
English
Complete Guide to Offline Prometheus Deployment: From Chart Export to Image Packaging

Preface
After successfully deploying Grafana, we need to configure a data source for it. Prometheus, as the most popular monitoring system, is a natural partner for Grafana. However, in an intranet environment, we also need to prepare Prometheus's offline deployment package in advance.
This article fully documents The process of creating an offline package for Prometheus Helm Chart, including:
Chart Pulling and Dependency Handling
Image version fix (the pitfall of the appVersion in the Chart being inconsistent with the actual image tag)
values configuration
Image export
Intranet deployment and verification
Environment Description
| Project | Information |
|---|---|
| Operating System | Ubuntu 22.04 / CentOS 7 |
| Kubernetes | 1.25+ |
| Helm version | v3.14.0+ |
| Chart version | prometheus-25.27.0 |
| Prometheus version | v2.54.1 |
| Container runtime | containerd |
Part 1: Pull the Prometheus Chart
1.1 Add Helm repository
bash
# Add Prometheus community repository
helm repo add prometheus-community https://prometheus-community.github.io/helm-charts
helm repo update
1.2 View available versions
bash
# Search Chart version
helm search repo prometheus-community/prometheus
1.3 Pull Chart
bash
# Pull the specified version (using 25.27.0 as an example)
helm pull prometheus-community/prometheus --version 25.27.0

# or pull the latest version
helm pull prometheus-community/prometheus

# Unzip and view
tar -zxvf prometheus-25.27.0.tgz
cd prometheus/
Part 2: Handling Chart Dependencies
2.1 View dependency information
bash
cat Chart.yaml | grep -A 20 "dependencies:"Output example:
yaml
dependencies:
- condition: alertmanager.enabled
  name: alertmanager
  repository: https://prometheus-community.github.io/helm-charts
  version: 1.12.*
- condition: kube-state-metrics.enabled
  name: kube-state-metrics
  repository: https://prometheus-community.github.io/helm-charts
  version: 5.25.*
- condition: prometheus-node-exporter.enabled
  name: prometheus-node-exporter
  repository: https://prometheus-community.github.io/helm-charts
  version: 4.39.*
- condition: prometheus-pushgateway.enabled
  name: prometheus-pushgateway
  repository: https://prometheus-community.github.io/helm-charts
  version: 2.14.*
2.2 Download all dependencies
bash
# Download dependencies to the charts/ directory
helm dependency update .

# View downloaded dependencies
ls -la charts/
# alertmanager-1.12.0.tgz
# kube-state-metrics-5.25.0.tgz
# prometheus-node-exporter-4.39.0.tgz
# prometheus-pushgateway-2.14.0.tgz
2.3 Repackage (including all dependencies)
bash
cd ..
helm package prometheus/
# Generate prometheus-25.27.0.tgz (including all sub-charts)
Part Three: Image Version Issues — Key Pitfalls
3.1 Problem Discovery
View the child Chart's appVersion:
bash
cat prometheus/charts/prometheus-node-exporter/Chart.yaml | grep appVersion
# appVersion: 1.8.2

cat prometheus/charts/kube-state-metrics/Chart.yaml | grep appVersion
# appVersion: 2.13.0
3.2 Problem Analysis
| component | appVersion in Chart | Docker Hub/Quay.io actual tag | Are they consistent? |
|---|---|---|---|
| prometheus-node-exporter | 1.8.2 | v1.8.2 | Missing v prefix |
| kube-state-metrics | 2.13.0 | v2.13.0 | Missing v prefix |
Key issues: in Chart appVersion without v prefix, but the tag in the image repository has v If the default values are used directly, the deployment will pull an image that does not exist.
3.3 Solution: Create a custom values file
cat > prometheus-values.yaml <<'EOF'
# Global Configuration
global:
  scrape_interval: 15s

# Disable unnecessary components (streamlined deployment in an intranet environment)
alertmanager:
  enabled: false
  image:
    repository: prometheus/alertmanager
    tag: v0.27.0
    pullPolicy: IfNotPresent

# Disable unnecessary components (streamlined deployment in an intranet environment)
prometheus-pushgateway:
  enabled: false
  image:
    repository: prometheus/pushgateway
    tag: v1.9.0
    pullPolicy: IfNotPresent

# Fix the Node Exporter image tag
prometheus-node-exporter:
  enabled: true
  image:
    repository: prometheus/node-exporter
    tag: v1.8.2          # with a v prefix
    pullPolicy: IfNotPresent

# Fix the kube-state-metrics image tag
kube-state-metrics:
  enabled: true
  image:
    repository: kube-state-metrics/kube-state-metrics
    tag: v2.13.0         # with a v prefix
    pullPolicy: IfNotPresent

# Prometheus Server Configuration
server:
  persistentVolume:
    enabled: false       # The test environment is not persistent.
  image:
    repository: quay.io/prometheus/prometheus
    tag: v2.54.1
    pullPolicy: IfNotPresent
EOF
Part 4: Verify Chart Configuration
4.1 Render the template and view the image address
bash
helm template test ./prometheus/ -n monitoring \
  -f prometheus-values.yaml \
  | grep -E "image:" | sort -u
4.2 Expected Output
yaml
image: "quay.io/prometheus-operator/prometheus-config-reloader:v0.76.0"
image: "quay.io/prometheus/alertmanager:v0.27.0"
image: "quay.io/prometheus/prometheus:v2.54.1"
image: "quay.io/prometheus/pushgateway:v1.9.0"
image: quay.io/prometheus/node-exporter:v1.8.2
image: registry.k8s.io/kube-state-metrics/kube-state-metrics:v2.13.0Attention:prometheus-config-reloader It is the sidecar container for ConfigMap hot reloading and needs to be pulled additionally.
4.3 Verify there are no duplicate registries
bash
helm template test ./prometheus/ -n monitoring \
  -f prometheus-values.yaml \
  | grep "image:" | grep "quay.io/quay.io"

# If there is no output, it means the configuration is correct.
Part 5: Pull and Save the Image
5.1 Complete Image List
| component | Mirror address | Purpose |
|---|---|---|
| Prometheus | quay.io/prometheus/prometheus:v2.54.1 | Main service |
| Node Exporter | quay.io/prometheus/node-exporter:v1.8.2 | Node metrics collection |
| kube-state-metrics | registry.k8s.io/kube-state-metrics/kube-state-metrics:v2.13.0 | K8s resource status |
| Alertmanager | quay.io/prometheus/alertmanager:v0.27.0 | Alarm Management |
| Pushgateway | quay.io/prometheus/pushgateway:v1.9.0 | Metrics Push Gateway |
| Config Reloader | quay.io/prometheus-operator/prometheus-config-reloader:v0.76.0 | Configuration hot reload |
5.2 One-Click Pull and Save Images
bash
#!/bin/bash
# Pull and save all images

mkdir -p images

images=(
  "quay.io/prometheus/prometheus:v2.54.1"
  "quay.io/prometheus/node-exporter:v1.8.2"
  "registry.k8s.io/kube-state-metrics/kube-state-metrics:v2.13.0"
  "quay.io/prometheus/alertmanager:v0.27.0"
  "quay.io/prometheus/pushgateway:v1.9.0"
  "quay.io/prometheus-operator/prometheus-config-reloader:v0.76.0"
)

for image in "${images[@]}"; do
    echo ">> Pulling: $image"
    docker pull $image
    tar_name=$(echo $image | tr '/' '_' | tr ':' '_').tar
    echo ">> Save: images/$tar_name"
    docker save $image -o images/$tar_name
done

echo "✅ Image export completed!"
ls -lh images/
Part Six: Organizing the Offline Package Directory
6.1 Final directory structure
prometheus-offline-25.27.0/
├── prometheus-25.27.0.tgz          # Helm Chart package (including all dependencies)
├── prometheus/                      # Source code directory (optional)
│   ├── Chart.yaml
│   ├── values.yaml
│   ├── templates/
│   └── charts/                      # Dependent sub-chart
│       ├── alertmanager-1.12.0.tgz
│       ├── kube-state-metrics-5.25.0.tgz
│       ├── prometheus-node-exporter-4.39.0.tgz
│       └── prometheus-pushgateway-2.14.0.tgz
├── prometheus-values.yaml           # Custom configuration
├── images/
│   ├── quay.io_prometheus_alertmanager_v0.27.0.tar
│   ├── quay.io_prometheus_node-exporter_v1.8.2.tar
│   ├── quay.io_prometheus_prometheus_v2.54.1.tar
│   ├── quay.io_prometheus_pushgateway_v1.9.0.tar
│   ├── quay.io_prometheus-operator_prometheus-config-reloader_v0.76.0.tar
│   └── registry.k8s.io_kube-state-metrics_kube-state-metrics_v2.13.0.tar
├── README.md                        # Deployment Instructions
└── install.sh                       # One-click installation script
└── import-images.sh                 # Worker node dedicated image import script
6.2 Create Deployment Instructions
bash
cat > README.md <<'EOF'
# Prometheus Offline Deployment Package v25.27.0

## File Description
- `prometheus-25.27.0.tgz` - Helm Chart package
- `prometheus-values.yaml` - custom configuration
- `images/` - Container image directory

## Deployment Requirements
- Kubernetes cluster 1.19+
- containerd or Docker runtime
- Helm 3.0+

## Quick Deployment

### Method 1: One-click installation
```bash
./install.sh
Method 2: Manual Deployment
1. Import image
bash
ctr -n k8s.io images import images/*.tar2. Install Chart
bash
helm install prometheus ./prometheus-25.27.0.tgz \\
  -n monitoring \\
  -f prometheus-values.yaml
3. Verification
bash
kubectl get pods -n monitoring
kubectl port-forward -n monitoring svc/prometheus-server 9090:80
Version Information
- Prometheus: v2.54.1
- Node Exporter: v1.8.2
- kube-state-metrics: v2.13.0
- Helm Chart: 25.27.0 EOF
### 6.3 Create a one-click installation script

```bash
cat > install.sh <<'EOF'
#!/bin/bash
# Prometheus offline one-click installation script
# Supports containerd and Docker

set -e

NAMESPACE=${1:-monitoring}
RELEASE_NAME=${2:-prometheus}

echo ">> Creating namespace..."
kubectl create namespace $NAMESPACE --dry-run=client -o yaml | kubectl apply -f -

echo ">> Importing image..."
if command -v ctr &> /dev/null; then
    echo ">> Using containerd..."
    for img in images/*.tar; do
        echo "  Import: $img"
        ctr -n k8s.io images import $img
    done
elif command -v docker &> /dev/null; then
    echo ">> Using Docker..."
    for img in images/*.tar; do
        echo "  Import: $img"
        docker load -i $img
    done
else
    echo "❌ containerd or Docker not detected"
    exit 1
fi

echo ">> Install Prometheus..."
helm install $RELEASE_NAME ./prometheus-25.27.0.tgz \
  -n $NAMESPACE \
  -f prometheus-values.yaml

echo ">> Waiting for Pod to be ready..."
kubectl wait --for=condition=ready pod -l app.kubernetes.io/name=prometheus -n $NAMESPACE --timeout=120s

echo ""
echo "✅ Prometheus deployed successfully!"
echo ""
echo "Access method:"
echo "  kubectl port-forward -n $NAMESPACE svc/prometheus-server 9090:80"
echo "  然后浏览器访问 http://localhost:9090"
EOF

chmod +x install.sh
6.4 Create an image import script (provided for multi-node Kubernetes clusters)
When a Kubernetes cluster has multiple nodes, we need to upload the offline package prometheus-offline-25.27.0.tar.gz to the worker nodes (that is, non-control-plane nodes). After extracting the offline package, you only need to execute import-images.sh Script: just import the image; no other operations are required!
bash
cat > import-images.sh <<'EOF'
#!/bin/bash
# Import the image to the current node

set -e

echo ">> Importing image..."
if command -v ctr &> /dev/null; then
    echo ">> Using containerd..."
    for img in images/*.tar; do
        echo "  Import: $img"
        sudo ctr -n k8s.io images import "$img"
    done
elif command -v docker &> /dev/null; then
    echo ">> Using Docker..."
    for img in images/*.tar; do
        echo "  Import: $img"
        sudo docker load -i "$img"
    done
else
    echo "❌ containerd or Docker not detected"
    exit 1
fi

echo "✅ Image import complete!"
EOF

chmod +x import-images.sh
6.5 Packaging and Delivery
bash
tar -czf prometheus-offline-25.27.0.tar.gz ./prometheus-offline-25.27.0
ls -lh prometheus-offline-25.27.0.tar.gz
Part 7: Intranet Deployment and Verification
7.1 Multi-node Deployment Instructions
⚠️ Special reminder for multi-node clusters:
If your Kubernetes cluster has multiple worker nodes, Please be sure to perform the operations in the following order; otherwise, when a Pod is scheduled to a node where the image has not been imported, image pull failure will cause abnormal startup (ImagePullBackOff/ErrImagePull).
Recommended workflow:
bash
# Step 1: Import the image on all worker nodes
# Copy the offline package to each worker node, extract it, and execute:
./import-images.sh

# Step 2: Perform the full installation on the control plane node
# After extracting the offline package, execute:
./install.sh
Why do it this way?
import-images.shOnly import images; do not perform Helm installation.Ensure all nodes have the image ready so that the Kubernetes scheduler can schedule Pods to any node.
Avoid nodes being unable to access external image registries (such as
registry.k8s.io,quay.io) caused byImagePullBackOff
7.2 Deployment
bash
# 1. Extract the offline package
tar -xzf prometheus-offline-25.27.0.tar.gz
cd prometheus-offline-25.27.0/

# 2. Perform one-click installation
./install.sh

### 7.1 Deployment

```bash
# 1. Extract
tar -xzf prometheus-offline-25.27.0.tar.gz
cd prometheus-offline-25.27.0/

# 2. One-click installation
./install.sh

# or specified namespace
./install.sh my-monitoring my-prometheus
7.3 Verify Deployment
bash
# View Pod status
kubectl get pods -n monitoring

# Expected output:
# NAME                                    READY   STATUS    RESTARTS   AGE
# prometheus-kube-state-metrics-xxx       1/1     Running   0          30s
# prometheus-node-exporter-xxx            1/1     Running   0          30s
# prometheus-server-xxx                   2/2     Running   0          30s

# View Service
kubectl get svc -n monitoring

# Port forwarding to access Prometheus UI
kubectl port-forward -n monitoring svc/prometheus-server 9090:80

# Access http://localhost:9090 in your browser
7.4 Verification Metrics Collection
bash
# Query in the Prometheus UI
# Input: up
# You should be able to see the status of all targets.

# Or use the API to query
curl http://localhost:9090/api/v1/query?query=up
Part 8: Adding a Prometheus Data Source in Grafana
8.1 Get the Prometheus service address
bash
# In-cluster access
kubectl get svc -n monitoring prometheus-server
# URL: http://prometheus-server.monitoring.svc.cluster.local:80

# Or expose using NodePort
kubectl patch svc prometheus-server -n monitoring -p '{"spec":{"type":"NodePort"}}'
kubectl get svc -n monitoring prometheus-server
# Access: http://<NodeIP>:<NodePort>
8.2 Adding a Data Source in Grafana
Log in to Grafana:
http://<Grafana-IP>:3000Left menu →Configuration→Data Sources
Click Add data source Select Prometheus
Configuration:
Name:
PrometheusURL:
http://prometheus-server.monitoring.svc.cluster.local:80Click Save & Test
8.3 Import Kubernetes Monitoring Dashboard
| Dashboard ID | Name | Explanation |
|---|---|---|
| 315 | Kubernetes Cluster Monitoring | Overall cluster status |
| 1860 | Node Exporter | Node resource monitoring |
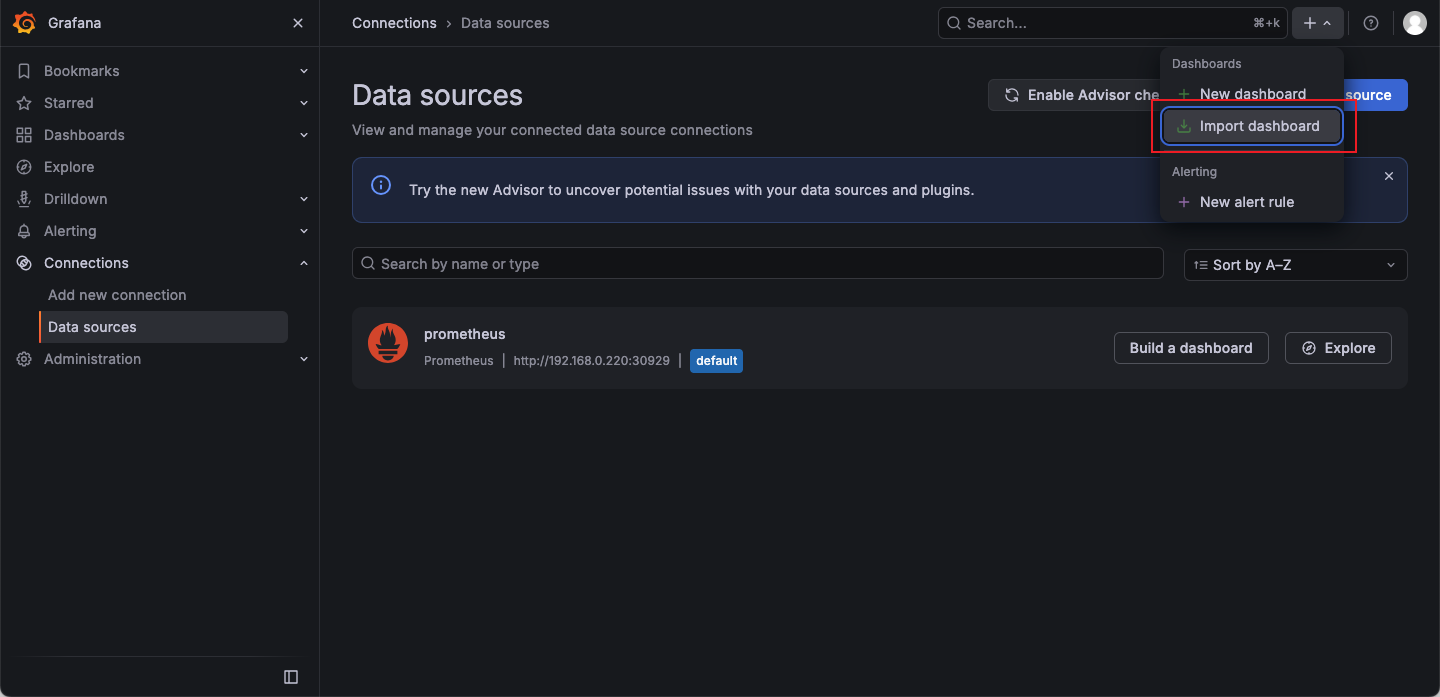
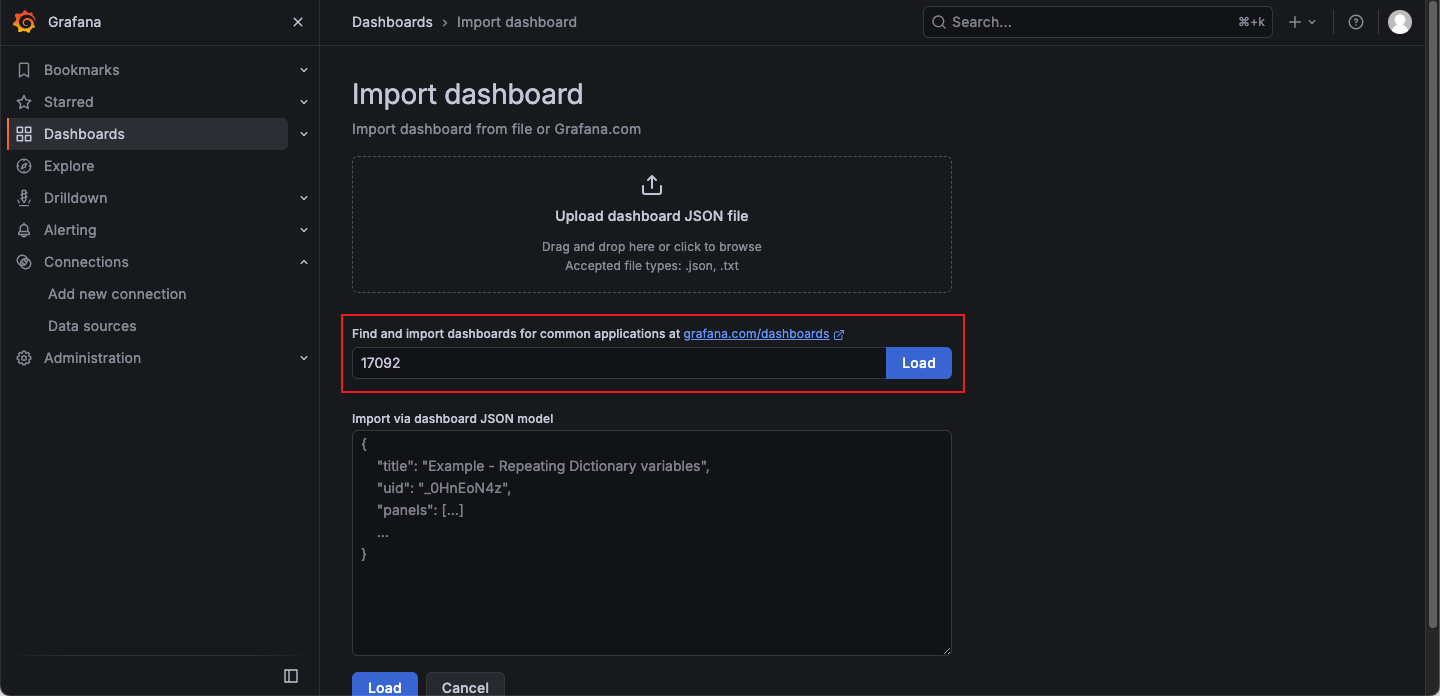
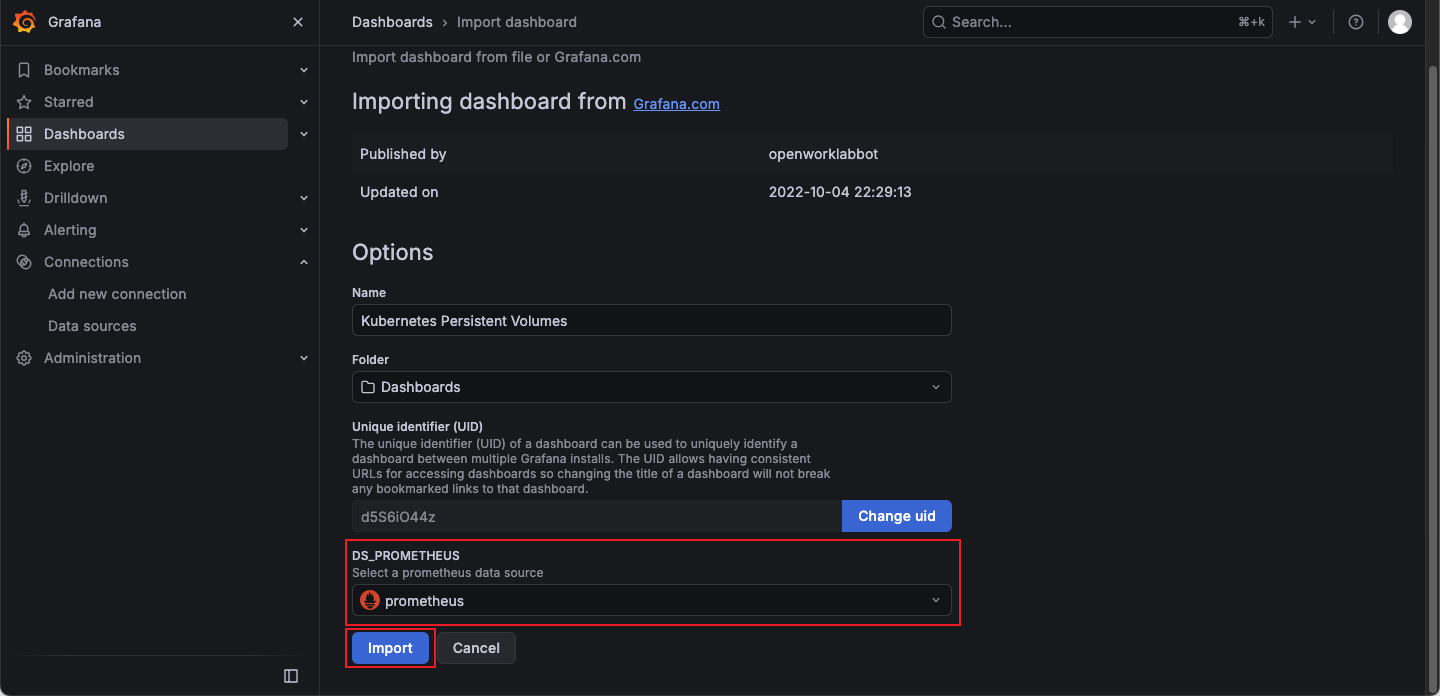
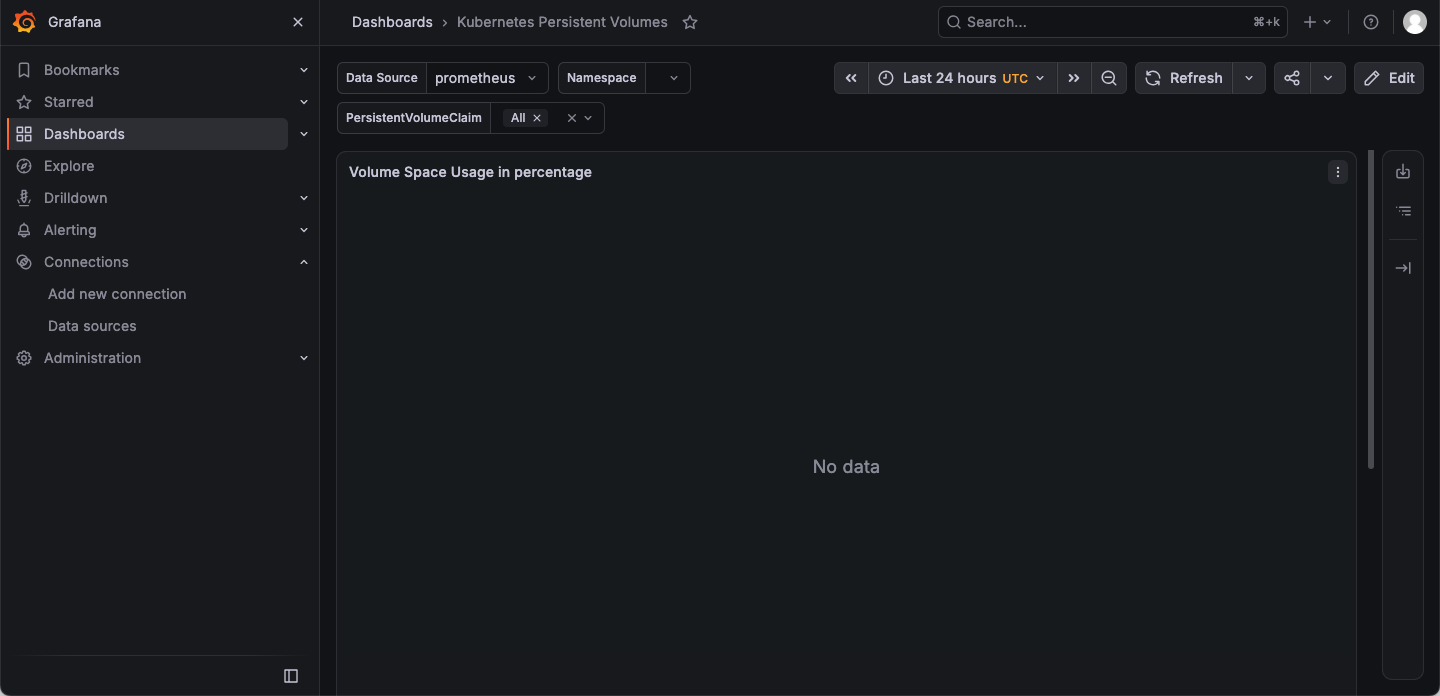
| 17092 | Kubernetes Persistent Volumes | PVC/PV Monitoring |
bash
# In Grafana
# Left side + → Import dashboard → Enter Dashboard ID
# Select Prometheus data source → Import
8.4 Example of Importing Kubernetes Persistent Volumes Data
Part Nine: Summary of Pitfalls
| Question | Cause | Solution |
|---|---|---|
| The image tag in the Chart is inconsistent with the actual one. | appVersion: 1.8.2 But the image tag is v1.8.2 | Explicitly specify in values.yaml tag: v1.8.2 |
| Duplicate mirror address after rendering | repository includes registry | Change to repository: prometheus/node-exporter, cooperate global.imageRegistry |
Omission config-reloader mirror image | Sidecar containers are not monitored by default. | helm template After checking all images, pull any missing ones. |
| Image pull failed during intranet deployment. | Images not imported into containerd | Use ctr -n k8s.io images import Import |
Conclusion
Through this article, you have mastered:
✅ How to pull the Prometheus Chart and handle dependencies
✅ How to identify and fix the issue where the image tag in the Chart is inconsistent with the actual one
✅ How to export all required images (including sidecar containers)
✅ How to organize a production-grade offline deployment package
✅ How to one-click deploy Prometheus in an intranet environment
✅ How to add a Prometheus data source in Grafana
Key points for creating a Prometheus offline package:
Chart dependencies must pass through
helm dependency updatedownloadImage tags need to be verified one by one and cannot be fully relied upon.
appVersionUse
helm templateRender and verify all image addresses.Both the image and the Chart are indispensable.
Related resources:
Attachment: Resource Download
If you do not want to create the offline package yourself, you can directly download the complete pre-built offline resource package, which includes all Helm Charts, container images, configuration files, and installation scripts described in this document.
| Resources | Download link | Explanation |
|---|---|---|
| offline package file | prometheus-offline-25.27.0.tar.gz | Prometheus v25.27.0 complete offline resource bundle, approximately 182 MiB (about 191 MB; file size varies depending on the operating system’s display standard) |
| SHA256 checksum | prometheus-offline-25.27.0.tar.gz.sha256 | Used to verify the integrity of the offline package and ensure the files are not corrupted. |
[!tip] Usage tips
After downloading the offline package, it is recommended to first use
sha256sum -c prometheus-offline-25.27.0.tar.gz.sha256Verify file integrity.Transfer the compressed package to the target intranet server's
/opt/Under the directory, then deploy according to the steps in Part 7, "Intranet Deployment and Verification," of this document.For multi-node Kubernetes clusters, be sure to refer to 7.1 Multi-node Deployment Instructions: first import the images on all worker nodes, then perform the installation on the control plane.