
English
Kubernetes PV Monitoring Practices: Grafana Dashboard Configuration and Data Display

Preface
In a Kubernetes cluster,Persistent Volume (Persistent Volume) It is the core resource for storing stateful application data. Whether databases, message queues, or gateway components like APISIX, their data persistence depends on the stable operation of PV/PVC.
However, PV monitoring is often overlooked—until the disk fills up and Inodes run out, at which point services suddenly stop.
This article provides a step-by-step guide on how to ... in Grafana Configure a Kubernetes Persistent Volumes monitoring dashboard from scratch, based on real cases (APISIX etcd data volumes), covering:
Prometheus data source configuration
Dashboard variable (filter) settings
Panel addition and data display
Common troubleshooting
Applicable scenarios A Kubernetes cluster that already has a Grafana + Prometheus + kube-state-metrics environment.
Environment Description
| Project | information |
|---|---|
| Grafana version | 13.2.0 |
| Prometheus version | v2.54.1 |
| Kubernetes | 1.25+ |
| Data source | Prometheus (configured) |
| Key indicators | kubelet_volume_stats_* |
| PVC case | data-apisix-etcd-0(Namespace:ingress-apisix) |
Part 1: Data Source and Filter Configuration (Options)
Before configuring any Panel, we need to first ensure the Prometheus data source is available and set up Dashboard variables (filters), allowing users to flexibly switch between Namespace and PVC.
1.1 Prometheus Data Source Configuration
If you have not yet added the Prometheus data source in Grafana:
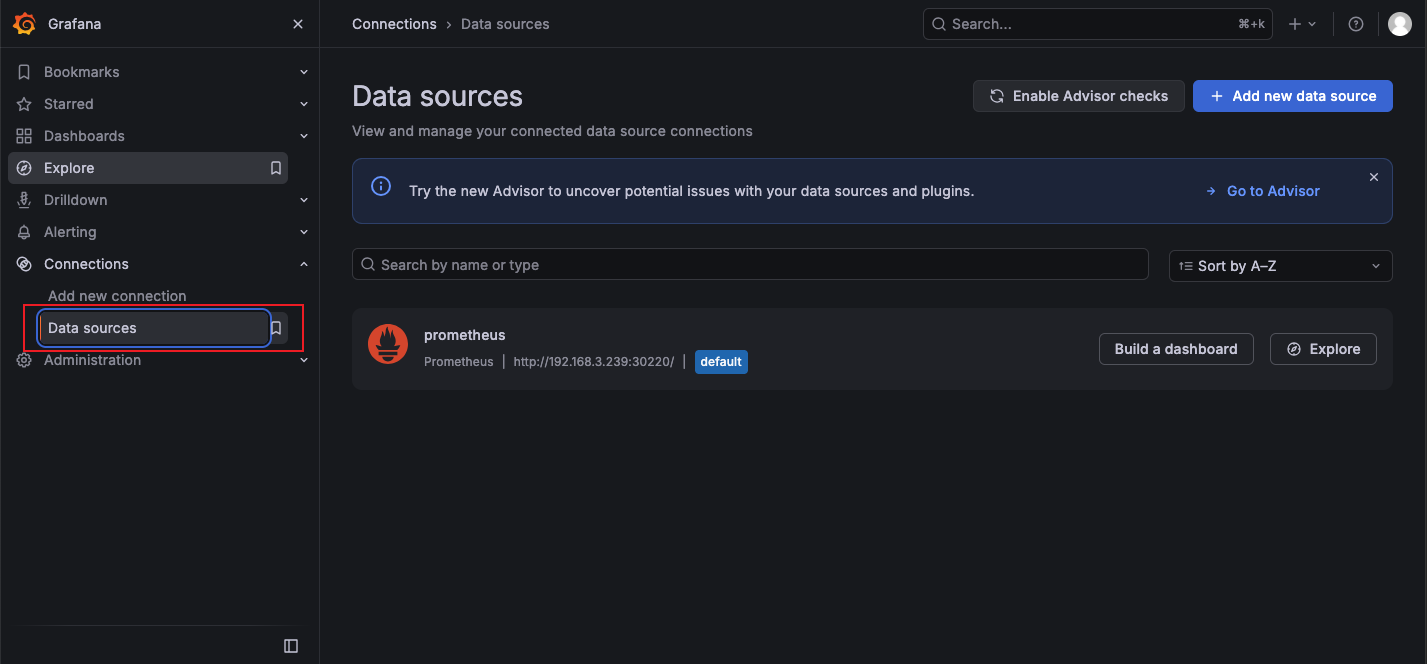
Step 1: Log in to Grafana, left-side menu →Connections → Data Sources
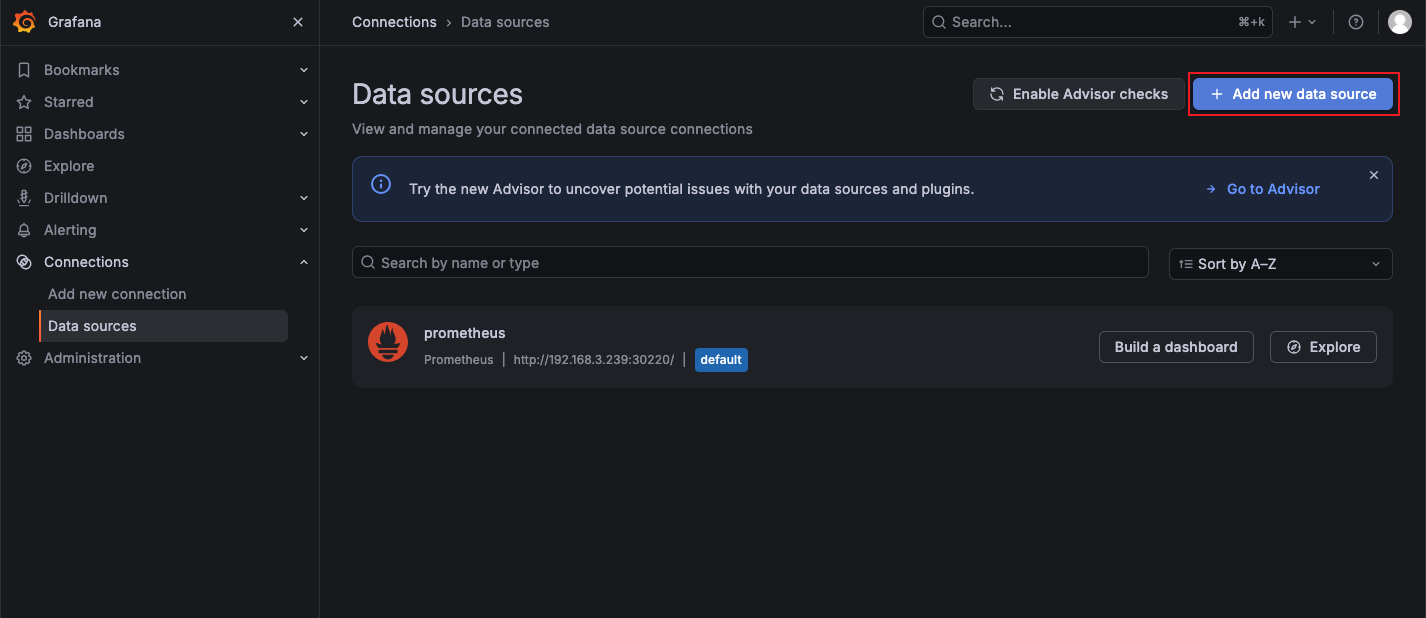
Step 2: Click Add data source→ Select Prometheus
Step 3: Fill in configuration information
| Configuration item | Fill in the content |
|---|---|
| Name | Prometheus |
| URL | http://prometheus-server.monitoring.svc.cluster.local:80(In-cluster access) |
or http://<NodeIP>:<NodePort>(NodePort mode) | | Access | Server (default) |
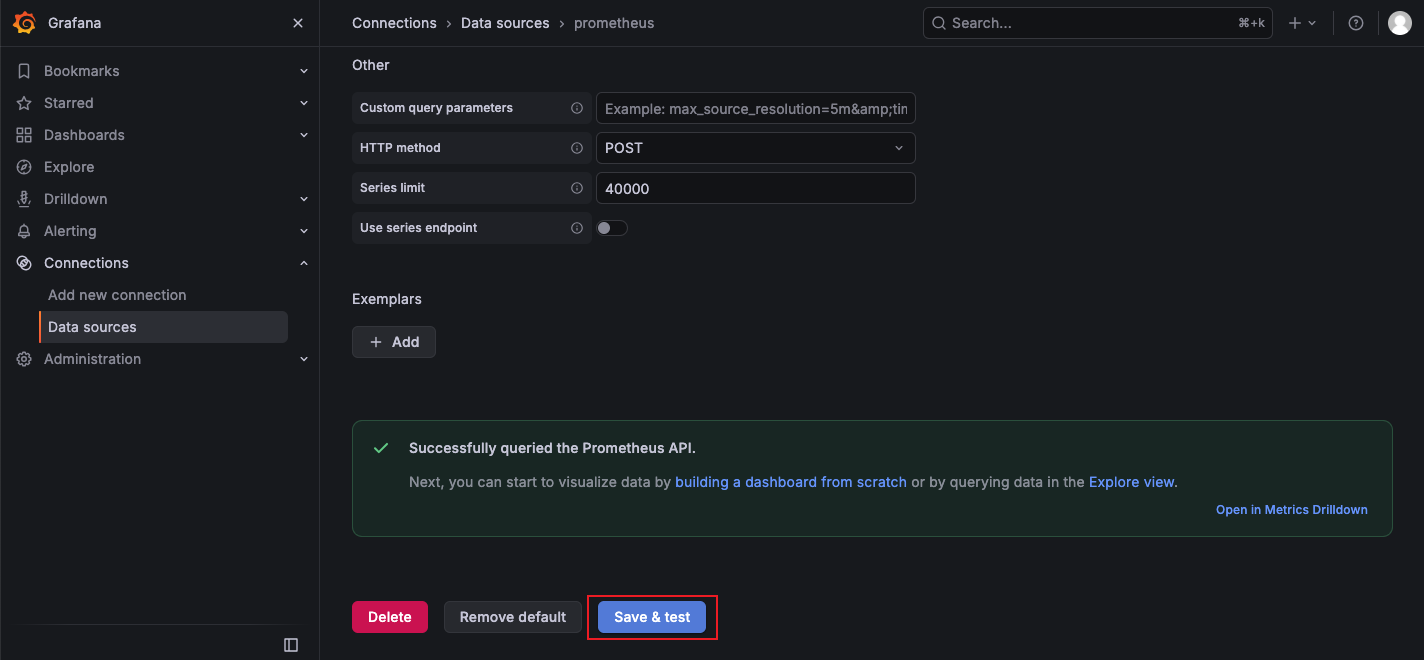
Step 4: Click Save & test, just wait until you see the green success prompt.
1.2 Import Dashboard
Variables and Panels both need to be configured in the Dashboard. Import Dashboard:
Left menu →+ → Import dashboard
Enter Dashboard ID:
17092(Kubernetes Persistent Volumes)Click Load, select Prometheus data source
Click Import
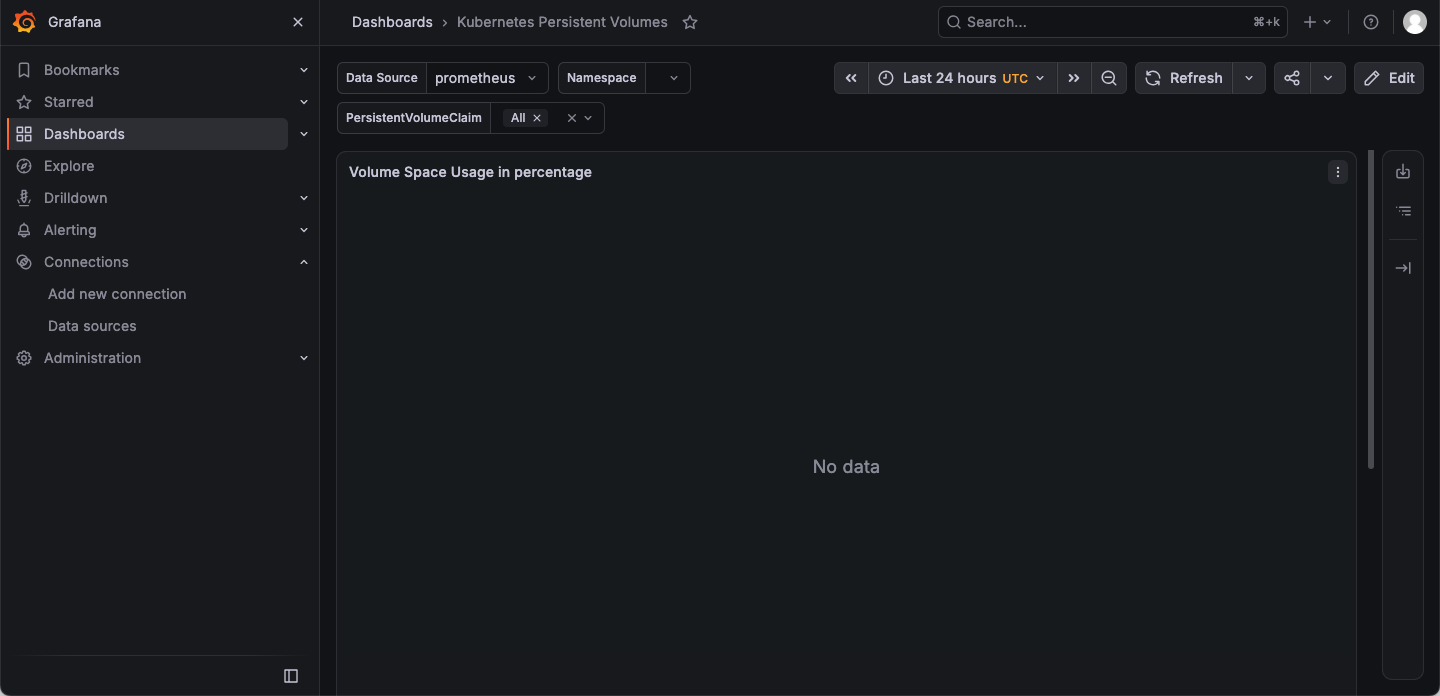
After a successful import, the default state is No data. The reason is a query syntax error, and we need to correct it manually before the visualization data can be displayed. However, before we start displaying the visualization data, we need to write the variables for the top visualization area.
1.3 Dashboard Variable Configuration
Variables make the Dashboard interactive. Users can select different Namespaces and PVCs through a dropdown menu without manually modifying the query statement.
Variable 1:cluster(Cluster selection)
If your Prometheus monitors multiple Kubernetes clusters, this variable is very useful.
| Configuration item | value |
|---|---|
| Name | cluster |
| Type | Query |
| Data source | Prometheus |
| Query | label_values(kubelet_volume_stats_used_bytes, cluster) |
| Include All option | ✅ Check |
| Multi-value | ✅ Check |
Description: If there is only one cluster, you can skip this variable or use the default value.
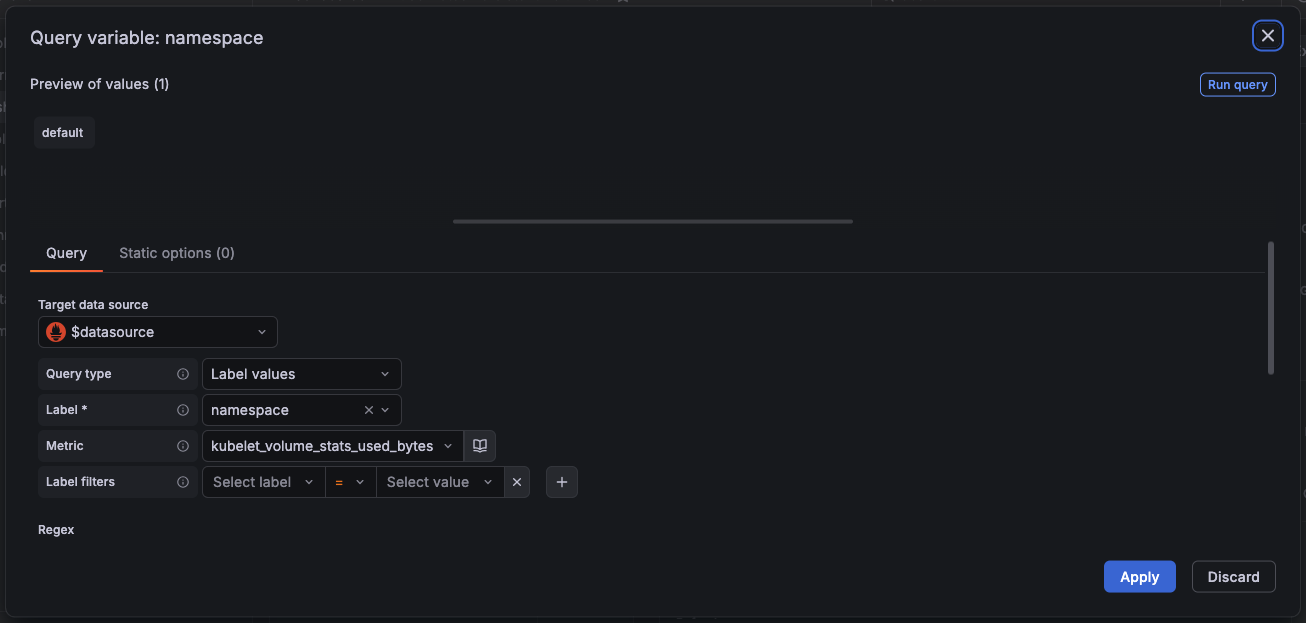
Variable 2:namespace(namespace)
This variable is used to filter Namespace so that users only focus on PVCs in a specific namespace.
| Configuration item | value |
|---|---|
| Name | namespace |
| Type | Query |
| Data source | Prometheus |
| Query | label_values(kubelet_volume_stats_used_bytes, namespace) |
| Include All option | ✅ Check |
| Multi-value | ✅ Check |
| Refresh | On Dashboard Load |
Configuration screenshot:
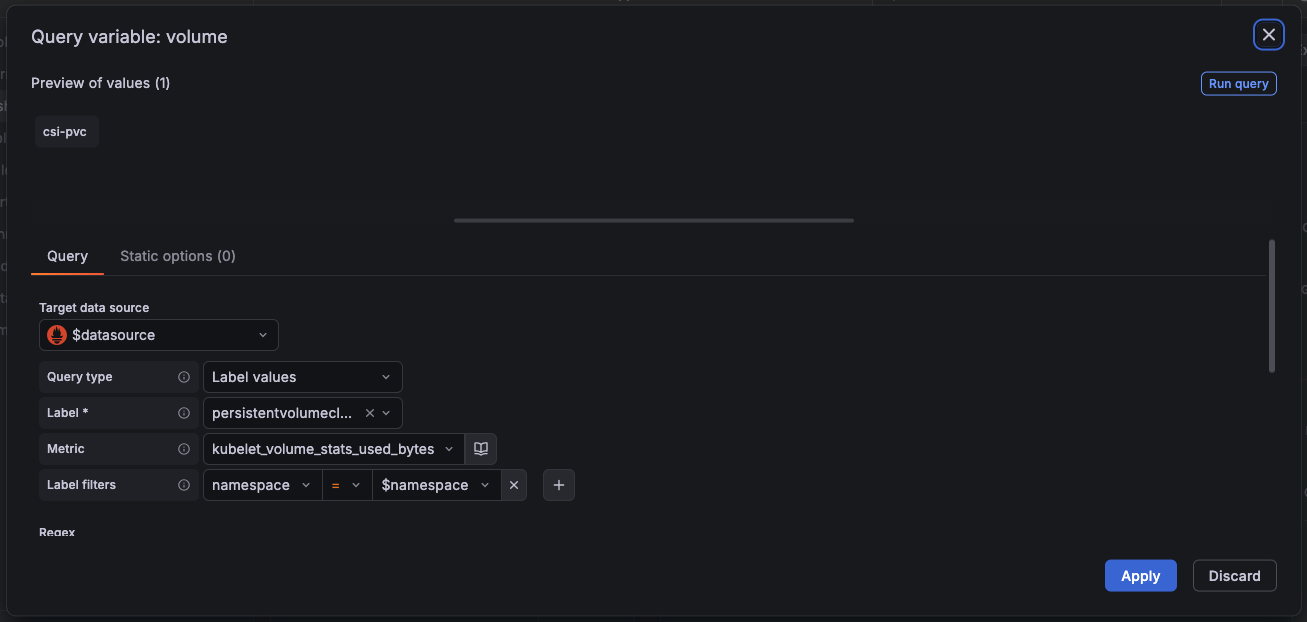
Variable 3:persistentvolumeclaim(PVC Selection)
This variable is Core filter, used to select the specific PVC.
| Configuration item | value |
|---|---|
| Name | persistentvolumeclaim |
| Type | Query |
| Data source | Prometheus |
| Query | label_values(kubelet_volume_stats_used_bytes{namespace="$namespace"}, persistentvolumeclaim) |
| Include All option | ✅ Check |
| Multi-value | ✅ Check |
| Refresh | On Dashboard Load |
Key points: used in Query $namespace Variables, implementation Variable linkage——After selecting a Namespace, the PVC list automatically refreshes.
Configuration screenshot:
Linkage relationships among variables
cluster → namespace → persistentvolumeclaim| variable | dependence | Linkage effect |
|---|---|---|
cluster | None | Select Cluster |
namespace | cluster(Optional) | After selecting a cluster, only Namespaces under that cluster are displayed. |
persistentvolumeclaim | namespace | After selecting a Namespace, only the PVCs under that Namespace are displayed. |
Configuration example:

1.4 Tips for Using Filters
Tip 1: Multi-select and Select All
Enable it in the variable configuration.Multi-value and Include All option:
Users can select multiple Namespaces at the same time.
Choose
AllWhen [condition], display all data.
Tip 2: Regular expression filtering
If you only want to display specific PVCs, you can use regular expressions in the Query:
txt
label_values(kubelet_volume_stats_used_bytes{namespace="$namespace", persistentvolumeclaim=~"data-.*|pvc-.*"}, persistentvolumeclaim)Part Two: Add PV Monitoring Panel
After the variables are configured, we add a Stat panel to show PVC usage.
2.1 Add Panel
Go to Dashboard → Click the upper right corner Add → Add a new panel
Panel title entry:
Volume stats for ${volume}
2.2 Configuration Data Query
| Configuration item | value |
|---|---|
| Data source | Prometheus |
| Query A (Total Capacity) Metric | kubelet_volume_stats_capacity_bytes |
| Query B (Used Space) Metric | kubelet_volume_stats_used_bytes |
| Query C (Remaining Space) Metric | kubelet_volume_stats_available_bytes |
Explanation: You only need to enter the Metric name here. Grafana will automatically use the variables at the top of the Dashboard ($namespace,$volume) injected into the query, no need to add manually {} Filter conditions.
2.3 Configure visualization options
| Configuration item | value |
|---|---|
| Panel type | Stat |
| Unit | bytes (IEC) |
| Stat style | Value |
| Orientation | Vertical(Vertical arrangement) |
| Color mode | None |
Panel type Panel type 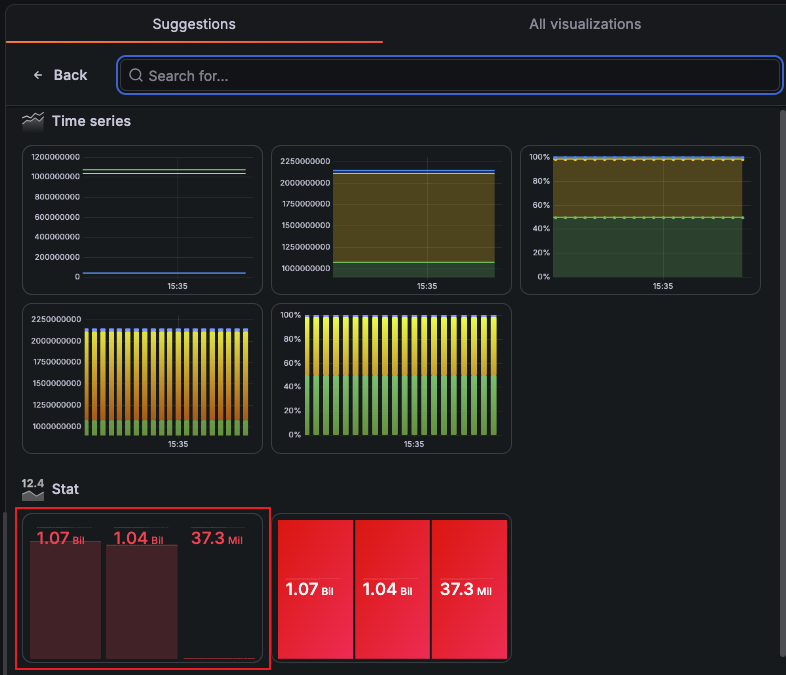
Unit panel data unit 
Orientation 
2.4 Final Effect
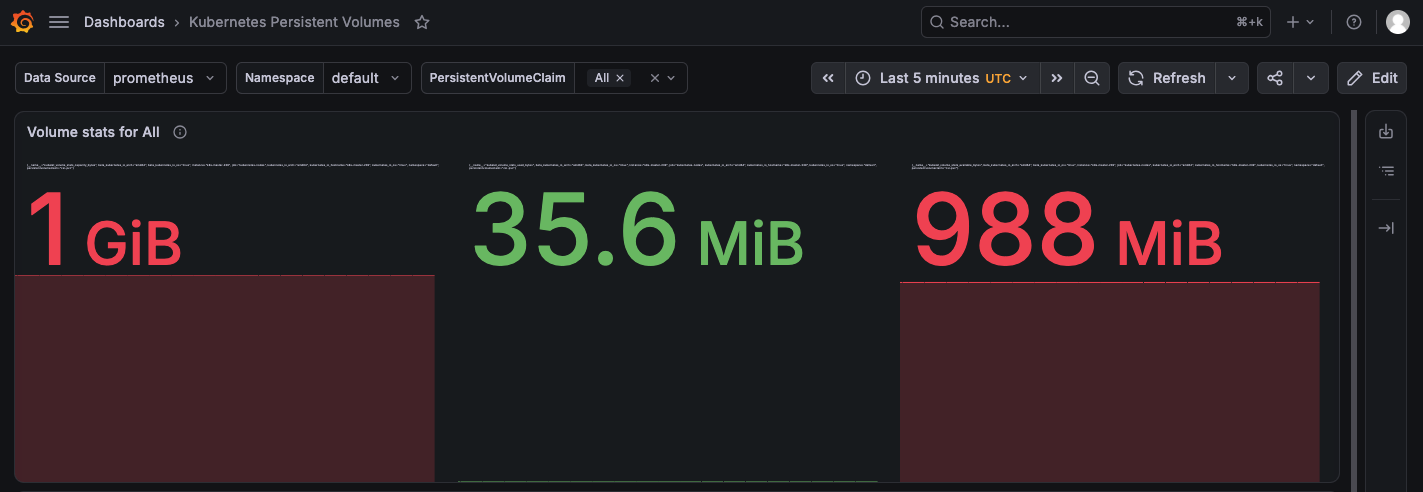
After configuration is complete, the Panel will display:
1 GiB 35.6 MiB 998 MiBRespectively correspond to:Total capacity,Used space,Remaining space(The unit is displayed as GiB according to the configuration).
第三部分:排障与常见问题
Q1: After importing the Dashboard, the default Panel displays "No data"
Reason:
- Query language and filter parameter error
Solution:
删除 Panel,重新添加。
Q2: The variable dropdown is empty
Reason:
Prometheus data source has no data
变量的查询语法有问题
Solution:
Edit the variable, delete the extra filter, add the correct metric name, and then click run query to search.
Conclusion
Through this article, you have mastered the complete process of configuring a Kubernetes Persistent Volumes monitoring dashboard in Grafana:
✅ Configure Prometheus data source
✅ Import Dashboard (ID:
17092)✅ Set Dashboard variables (cluster, namespace, PVC) to enable linked filtering
✅ Fix the query statement so that the Panel correctly displays the data
Core idea:
Configure the filter first.: Enable users to quickly locate the target PVC.
Revise the query again: Make variables truly take effect in Panel
Final service operations and maintenance: Early warning before capacity is exhausted
Monitoring is not the goal; stable operation is. We hope this article helps you better safeguard the storage health of your Kubernetes cluster!
Related resources:
All operations in this article have been verified in an environment with Kubernetes 1.25+, Grafana 13.2.0, and Prometheus v2.54.1.